

Cotality: External Pressures Suppress Home Price Growth Across the U.S.
Cotality, a leading global property information, analytics, and data-enabled solutions provider, released its latest Cotality Home Price Index™ (HPI™) for April 2025. April posted the lowest home price growth in more than a decade. Widespread concern about personal finances, job prospects, and potential tariff impacts continues to weigh on home prices.
This press release features multimedia. View the full release here: https://www.businesswire.com/news/home/20250603667663/en/
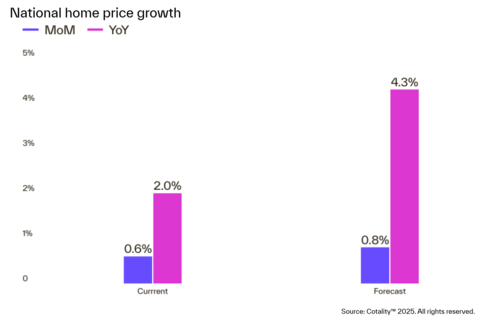
HPI & HPI Forecast % Change MoM and YoY in April 2025
“Housing market headwinds continue to challenge homebuying demand, but improved for-sale supply is providing buyers with more options and helping keep softer price pressures for those looking to buy this spring. And while annual home price growth has slowed considerably, home prices this spring have held up, and gains have mostly mirrored trends seen before the pandemic. This is encouraging given the fears that consumer sentiment has faltered. Cotality’s home price forecast for the coming month expects the solid home price trend to continue,” said Cotality’s Chief Economist Dr. Selma Hepp.
The Northeast, which has been an outlier in recent months and posting solid growth, had a couple of states reverse course in April. New York and Vermont posted home prices that were furthest from their peaks. Also, more markets are posting negative growth, with Hawaii, Florida, Texas, and Washington D.C. seeing price appreciation dip to -2%, -0.8%, -0.7%, and -0.6%, respectively.
“It is important to note that the number of markets where home prices are declining has not grown notably,” explained Hepp. “About 14 of the 100 largest markets reported annual declines, up from 12 markets last month, with the majority concentrated in Florida and Texas. Cape Coral, Florida shows the largest annual decline at 7% year over year, and prices are back at levels seen in the spring of 2022.”
Florida continues to course correct after years of explosive growth. Cotality’s Office of the Chief Economist reveals that several markets in the state are seeing price declines — the state overall saw -0.8% price appreciation in April — and all five of the U.S.’s most at-risk markets are located in the Sunshine State. Florida also saw its median sales price dip below the national median to $390,000, dropping the state out of the top 20 most expensive markets.
The next Cotality Home Price Index will be released July 1, featuring data for May 2025. For ongoing housing trends and data, visit the Cotality Insights blog: www.cotality.com/insights.
Methodology
The Cotality HPI™ is built on industry-leading public record, servicing and securities real-estate databases and incorporates more than 45 years of repeat-sales transactions for analyzing home price trends. Generally released on the first Tuesday of each month with an average five-week lag, the Cotality HPI is designed to provide an early indication of home price trends by market segment and for the Single-Family Combined tier, representing the most comprehensive set of properties, including all sales for single-family attached and single-family detached properties. The indices are fully revised with each release and employ techniques to signal turning points sooner. The Cotality HPI provides measures for multiple market segments, referred to as tiers, based on property type, price, time between sales, loan type (conforming vs. non-conforming) and distressed sales. Broad national coverage is available from the national level down to ZIP Code, including non-disclosure states.
Cotality HPI Forecasts™ are based on a two-stage, error-correction econometric model that combines the equilibrium home price—as a function of real disposable income per capita—with short-run fluctuations caused by market momentum, mean-reversion, and exogenous economic shocks like changes in the unemployment rate. With a 30-year forecast horizon, Cotality HPI Forecasts project Cotality HPI levels for two tiers — Single-Family Combined (both attached and detached) and Single-Family Combined Excluding Distressed Sales. As a companion to the Cotality HPI Forecasts, Stress-Testing Scenarios align with Comprehensive Capital Analysis and Review (CCAR) national scenarios to project five years of home prices under baseline, adverse and severely adverse scenarios at state, metropolitan areas and ZIP Code levels. The forecast accuracy represents a 95% statistical confidence interval with a +/- 2% margin of error for the index.
About Market Risk Indicators
Market Risk Indicators are a subscription-based analytics solution that provide monthly updates on the overall health of housing markets across the country. Cotality data scientists combine world-class analytics with detailed economic and housing data to help determine the likelihood of a housing bubble burst in 392 major metros and all 50 states. Market Risk Indicators is a multi-phase regression model that provides a probability score (from 1 to 100) on the likelihood of two scenarios per metro: a >10% price reduction and a ≤ 10% price reduction. The higher the score, the higher the risk of a price reduction.
About the Market Condition Indicators
As part of the Cotality HPI and HPI Forecasts offerings, Market Condition Indicators are available for all metropolitan areas and identify individual markets as overvalued, at value or undervalued. These indicators are derived from the long-term fundamental values, which are a function of real disposable income per capita. Markets are labeled as overvalued if the current home price indexes exceed their long-term values by greater than 10% and undervalued where the long-term values exceed the index levels by greater than 10%.
Source: Cotality
The data provided are for use only by the primary recipient or the primary recipient's publication or broadcast. This data may not be resold, republished or licensed to any other source, including publications and sources owned by the primary recipient's parent company without prior written permission from Cotality. Any Cotality data used for publication or broadcast, in whole or in part, must be sourced as coming from Cotality, a data and analytics company. For use with broadcast or web content, the citation must directly accompany first reference of the data. If the data are illustrated with maps, charts, graphs or other visual elements, the Cotality logo must be included on screen or website. For questions, analysis or interpretation of the data, contact Charity Head at newsmedia@Cotality.com. Data provided may not be modified without the prior written permission of Cotality. Do not use the data in any unlawful manner. The data are compiled from public records, contributory databases and proprietary analytics, and its accuracy is dependent upon these sources.
About Cotality
Cotality accelerates data, insights, and workflows across the property ecosystem to enable industry professionals to surpass their ambitions and impact society. With billions of real-time data signals across the life cycle of a property, we unearth hidden risks and transformative opportunities for agents, lenders, carriers, and innovators. Get to know us at www.cotality.com.
View source version on businesswire.com: https://www.businesswire.com/news/home/20250603667663/en/
Distribution channels:
Legal Disclaimer:
EIN Presswire provides this news content "as is" without warranty of any kind. We do not accept any responsibility or liability for the accuracy, content, images, videos, licenses, completeness, legality, or reliability of the information contained in this article. If you have any complaints or copyright issues related to this article, kindly contact the author above.
Submit your press release