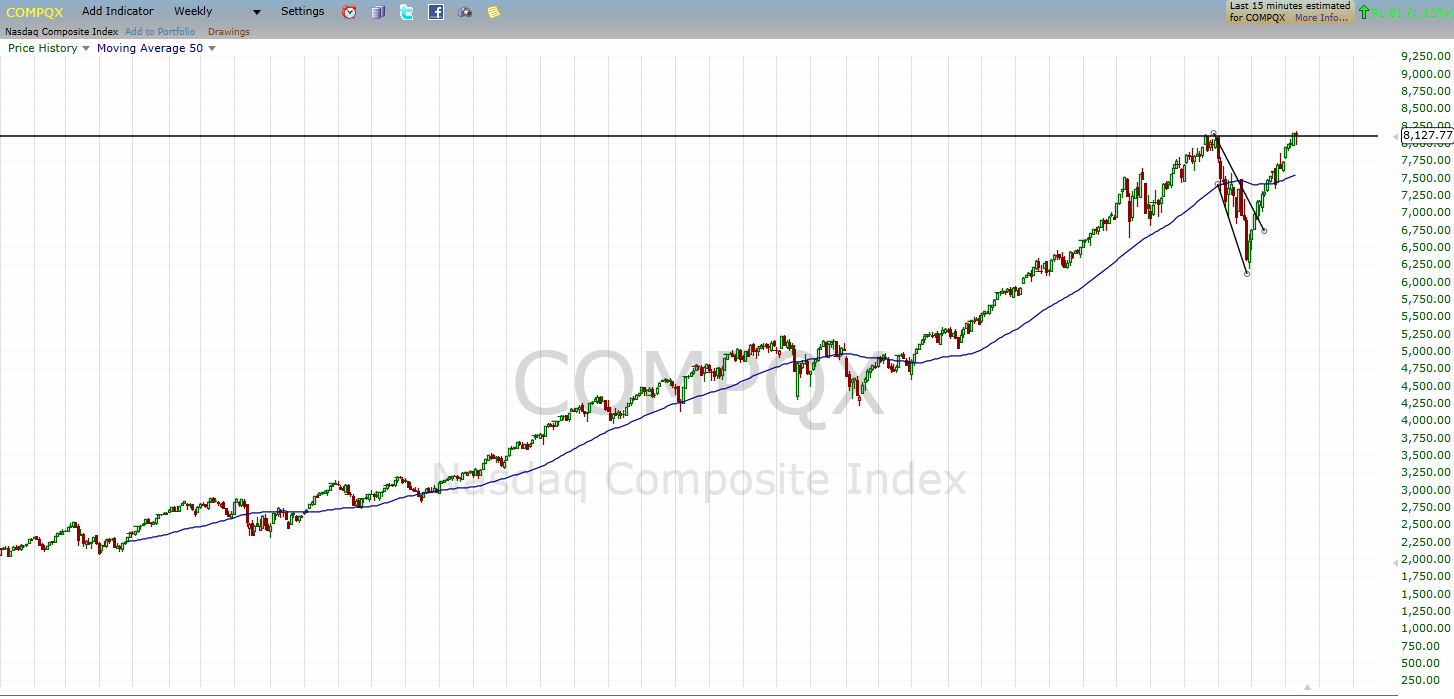
For the first four months of 2019 we have seen one of the strongest bull markets we have experience in decades. In fact, over the last 6 months or so, investors have experienced one of the most dramatic sell-offs ever, followed by one of the biggest up moves. If you look back over the last 10 years or so, you can see how dramatic these moves have been. Take a look at the NASDAQ Composite Index from 2009 to 2019:
If you look to the far-right side of the chart you will see this sharp sell-off followed by the strong rally which we are currently in. As we look at the charts below, you will see the prices are continuing to test out the all-time highs. This move, in part, is due to the overall strength in the economy. This week we saw some overall positive reports come out as the Fed Meeting was reported on and on Friday, we saw the unemployment rate drop to 3.6%, the lowest levels since the 1960’s. While we know this won’t last forever, we also don’t want to think it is going to change quickly. Doing so will put us in the mindset of trying to trade what we think might happen when we still need to trade what is actually happening. The markets will change, we just don’t want to expect it before the evidence on the charts actually support that the change is happening.
Let’s take a look at how the markets performed this last week.
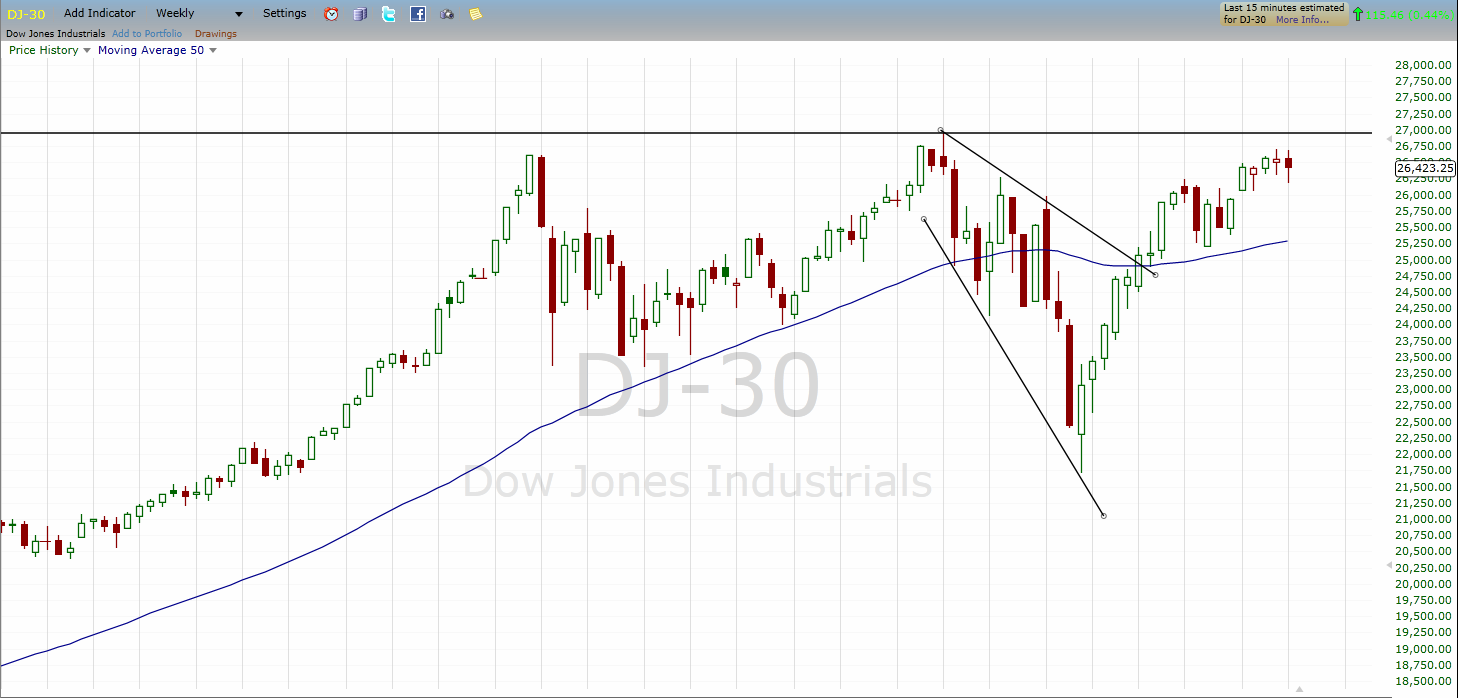
The chart above is the weekly candlestick chart of the DJ-30. This means that each of the candles represent the 5 trading sessions of this last week. Looking at these candles, you can begin to see that they are becoming smaller in their ranges. Over the past 4 weeks, the pattern of large candlesticks has begun to slow. In fact, the flattening of the price range of the last 4 candles might indicate that the market is slowing a bit and that we might see sellers try to push prices back down again. While this doesn’t mean the market is moving into a bear market, it does give us the first signs that it could. On the other hand, it is fairly normal to see the price action pull back after the price has moved higher, like we have seen the last couple of months. We will continue to monitor what is happening and make changes to our bias as the evidence on the chart begins to appear.
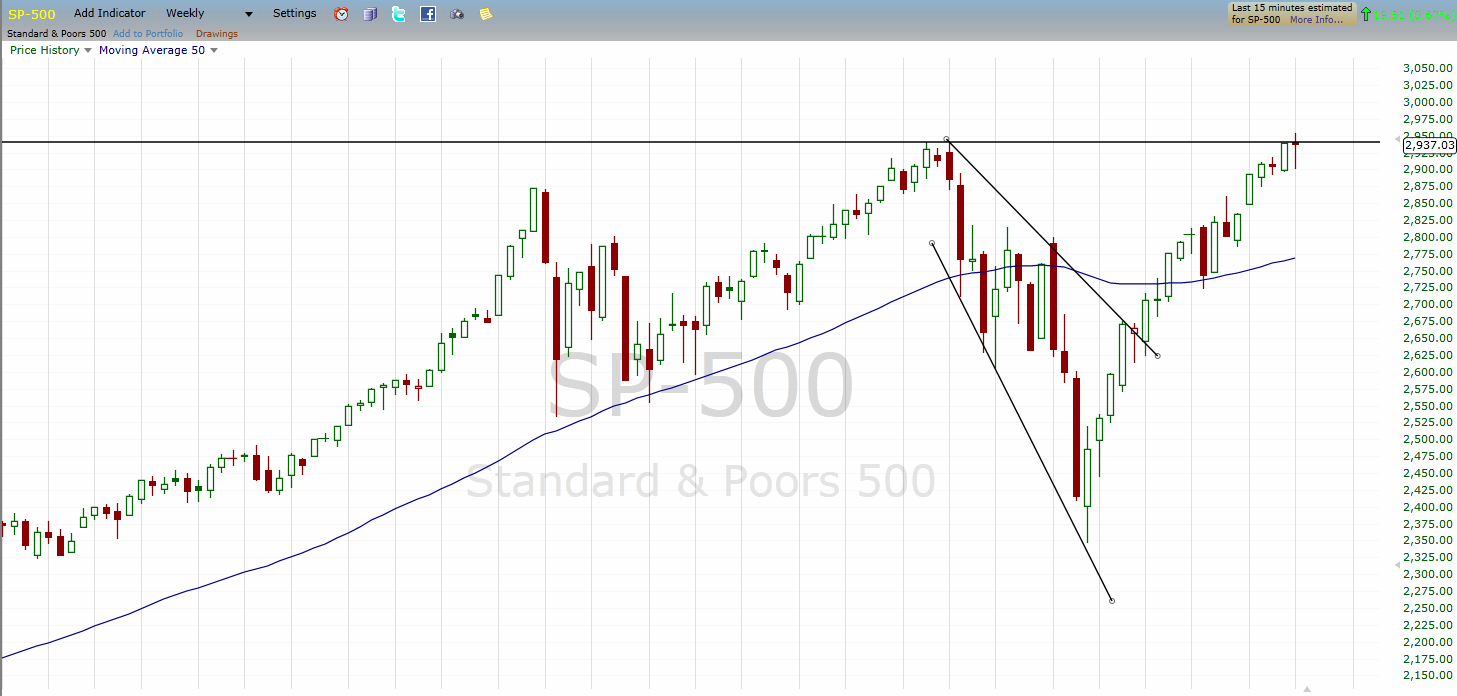
In the weekly chart of the SP-500 we can see that the price moved above the all-time highs and then slowed down. This price area may be tested several times to see if there is enough strength to break through and put in more new highs. If it can’t, then we are likely to see a nice pull back into past areas of support. While the overall trend is still strong and the 50-period simple moving average is pointing up, we do expect to see prices retrace back towards the 50-SMA at some point.
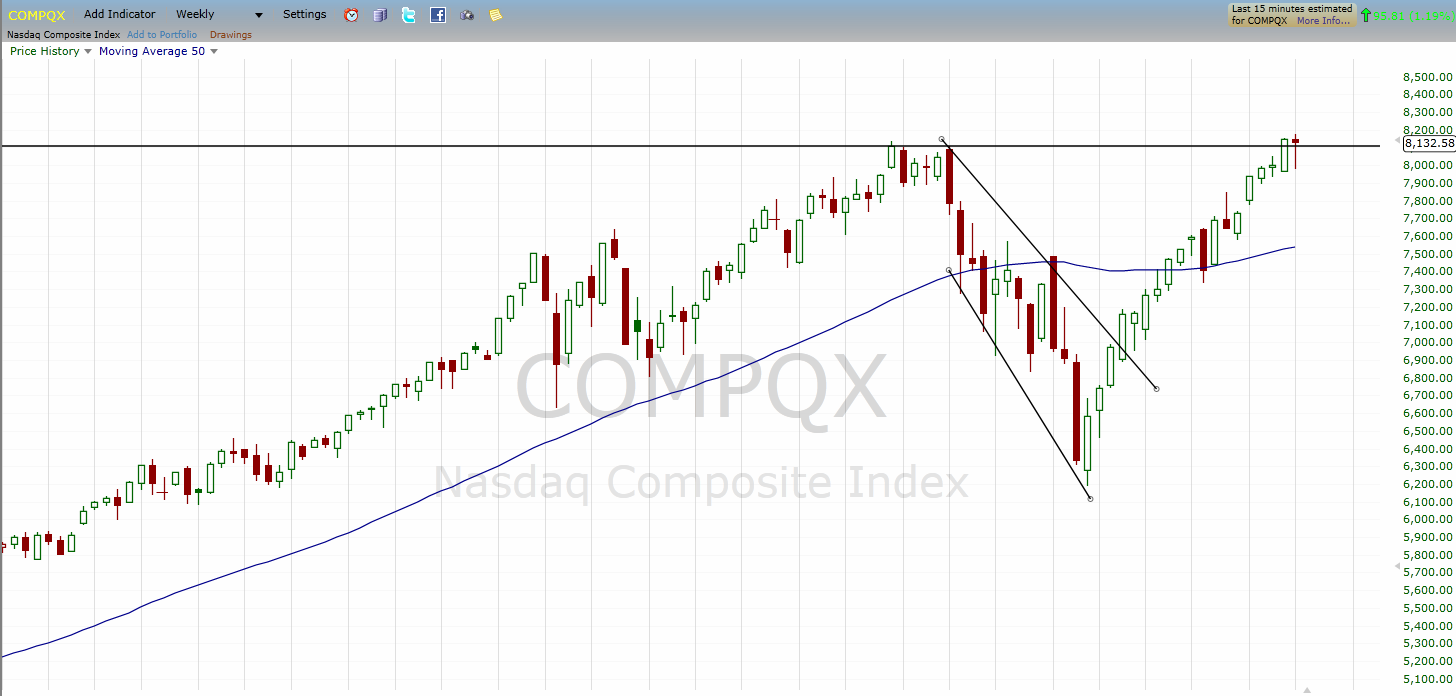
The Nasdaq continues to remain strong and actually closed in some new all-time high levels over that past couple of weeks. It is also well above the moving average which may be a sign that prices will try to retreat back down. We will be watching this to see if, or when, it actually begins to move.
Overall, we have continued to be in a bullish market and have seen the good economic news supporting it. We are also seeing a pretty good earnings season which we will continue to watch this upcoming week. As always, make sure you are using good risk and money management in all your trades, so you are prepared to exit your trades at the appropriate places.


